Why $ETH has been unattractive to most institutional investors up until now (part 1)
how institutional investors may navigate the liquidity profile of $ETH


Photo: Martin Leissl/Bloomberg
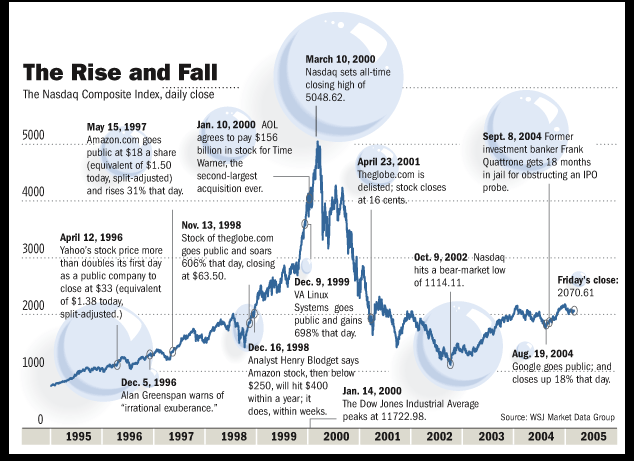
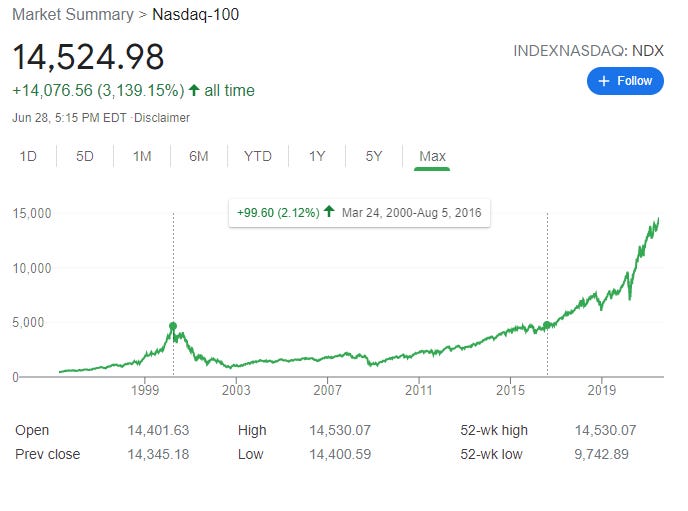
A critical part of the crypto multi-year super-cycle thesis has been that retail was first and institutional investors have yet to take the plunge (unlike the dot com bubble where the IIs came first and then retail came in, ending in a bubble burst that the NDX didn’t recover from for 16 years.)
Fast-forward to 2021 when $BTC hit $1 T market capitalization and $ETH hit $500 B before receding lower. Despite these almost dizzying valuations, the road to institutional acceptance has been and continues to be problematic. Matters regarding regulations and misconceptions about the intentions, capabilities, and limitations of public blockchains still plague the 11 year old asset class.
There’s a myriad of reasons as to why “institutional investors” (IIs) have been and still could be put-off from investing into Ethereum (or $ETH);
market structure (liquidity)
DAO Hack
[overly? ] Flexible monetary policy
custody
privacy
token velocity
fat protocol thesis
promised yield
voting power in DAOs and PoS
This series will explore some of these reasons and touch on what has and hasn’t changed.
An institutional investor is a company or organization that invests money on behalf of other people. Mutual funds, pensions, and insurance companies are examples. Institutional investors often buy and sell substantial blocks of stocks, bonds, or other securities and, for that reason, are considered to be the whales on Wall Street. The group is also viewed as more sophisticated than the average retail investor and, in some instances, are subject to less restrictive regulations.1
The identity of IIs is primarily to distinguish retail from “professional” investors. Simply put; IIs are definitely bigger and somewhat smarter (debatable; see Mark Cuban Calls for Stablecoin Regulation After Trading Token That Crashed to Zero), and better equipped than the rest of us. A brief overview of the assets under management (AUM) for some of the types of IIs;
$88.5 trillion
The North American asset management industry controlled more than $88.5 trillion at the end of 2017, according to McKinsey estimates.2
Some breakdowns;
Global Hedge Funds AUM: $3.8 T (2020)3
Public and Private Sector Pension Funds in U.S. AUM: $8.6 T (2018)4.
Global Top 100 Largest Endowments AUM: 0.929 T (20??)5
BlackRock AUM: $9.01 T (Q1 2021)6
Vanguard AUM: $7.2 T (Q1 2021)7
Fidelity AUM: $10.4 T (3/2021)8
State Street AUM: $3.15 T (Q3 2020)9
Charles Schwab: $4.10 T (Q1 2021)10
Allianz AUM: $2.69 T (Q4 2020)11
Global Top 100 Sovereign Wealth Funds: $8.41 T (20??)12
Global Top 100 Largest Insurance Companies by AUM: $19.59 T (20??)13
15 Largest U.S. Banks AUM: $12.82 T (3/2021)14
Big Tech Cash Reserves (APPL + MSFT + AMZN + GOOG + FB): $0.588 T (10/2020)15
Characteristics and Behaviors of IIs
The term II is rather broad when one considers the risk profiles and allocations of a $10 T AUM mutual fund behemoth versus a typical hedge fund of <$100 M AUM16. One can liken the contrast in maneuverability to different vehicle classes; a semi truck versus say a Porsche 911. The semi truck can handle/move a substantially larger load (or amount of money) but lacks the Porsche’s agility (asset allocation flexibility). The Porsche is of course faster than the semi truck. The speed analogy can pertain to both how much faster a hedge fund can take the plunge (because of liquidity restrictions and investor protection regulations) and also how much faster they can generate returns. However, the semi truck is steadier in speed and more durable than the versatile high-accelerating Porsche. This comparison can apply to their strategies of making returns (which will be discussed further below) and how many hedge funds come and go over the years.
For simplification purposes we can generalize IIs into average-sized hedge funds (HFs) (small) and big asset managers (AMs) (like Blackrock).
The AMs in the II spectrum are typically long as opposed to a HFs that can be both long and short or vast majority short (and therefore enabling better bear market returns), and also net neutral. (Some data on this below)
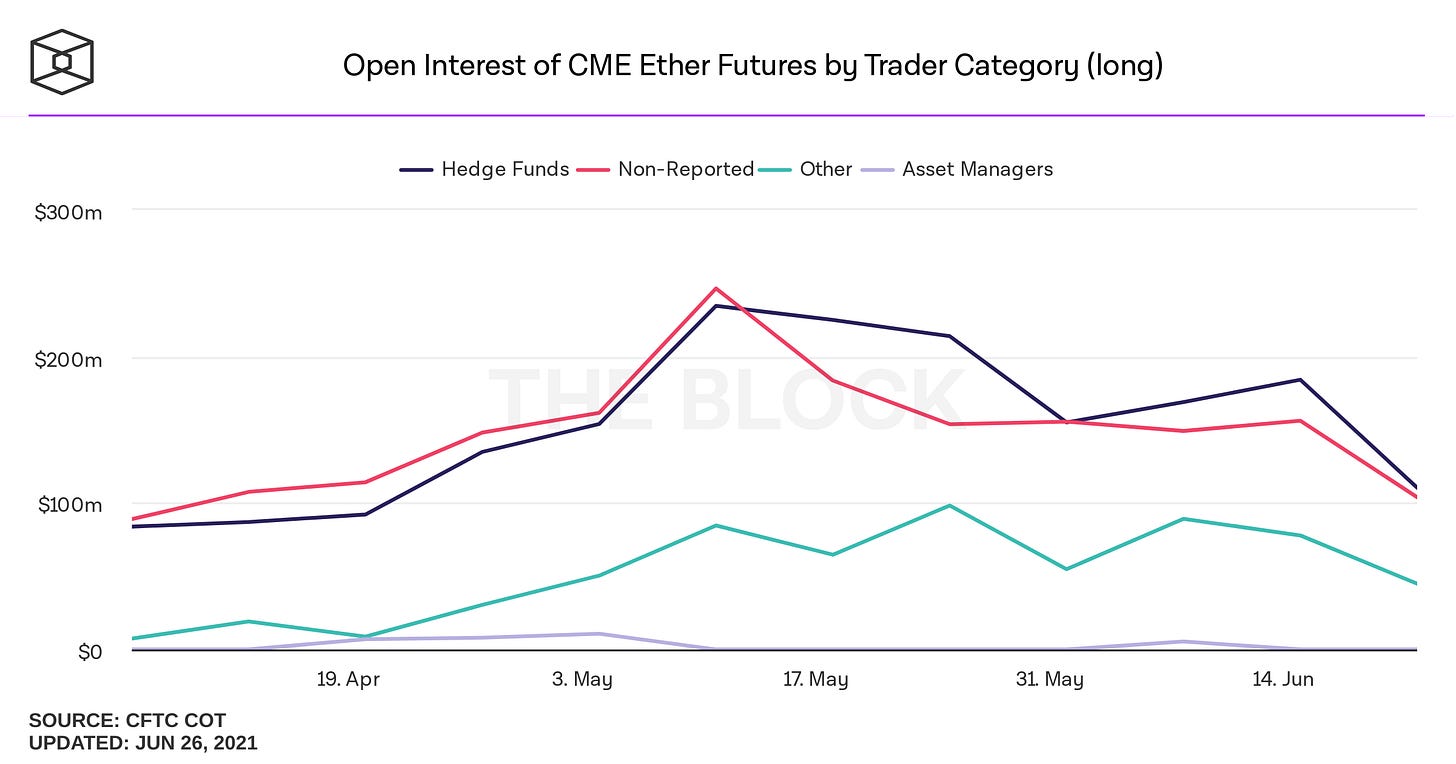
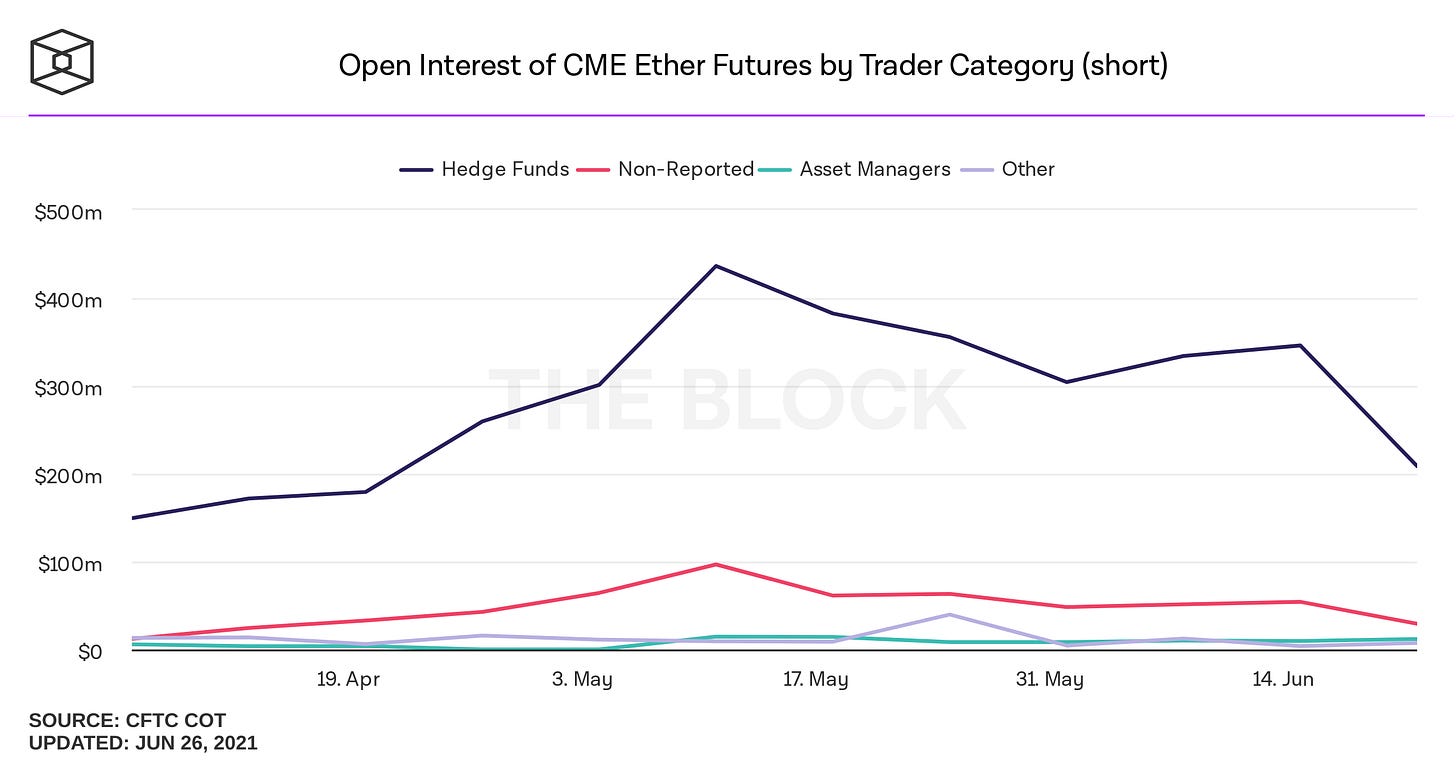
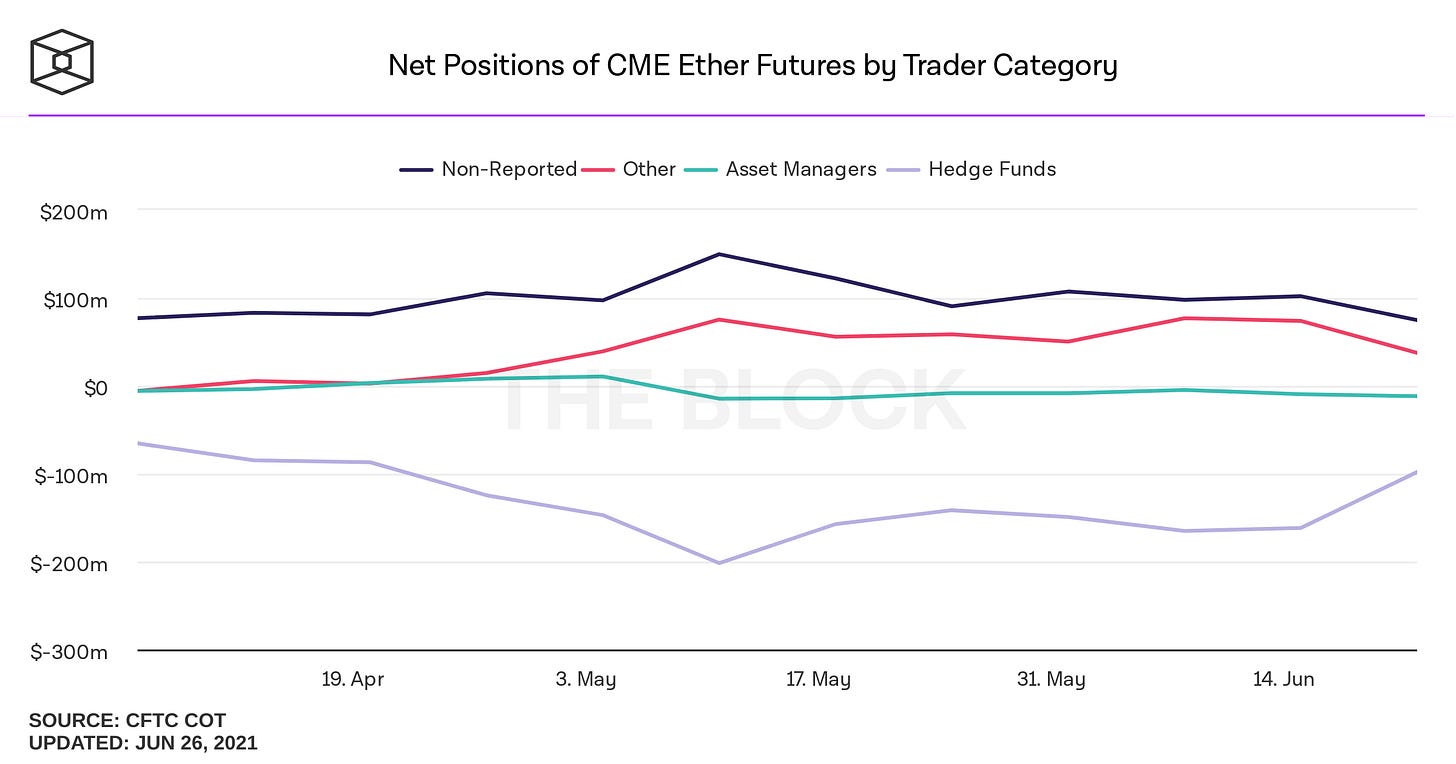
Note asset managers are relatively flat here, while HFs are hedging.
HFs are more active, AMs are more passive.
HFs use more leverage than AMs.
HFs have potential for higher returns than AMs.
HFs are private, exclusive, and often secretive and therefore more opaque than say a Blackrock.
Due to their flexibility, HFs have access to more markets.
The demands and standards of a HF are more aggressive and tough since the [unwritten] goal is to “beat the market” (though this is debatable) while justifying notoriously high fees (see James Simons’s RenTech).
The larger players are also more likely and better equipped to pursue influence and power. Aside from the fact that Blackrock is managing more money than the nominal GDP of Japan, they also have substantial voting power in the companies they invest in.
Common stock shareholders in a publicly-traded company have certain rights pertaining to their equity investment, and among the more important of these is the right to vote on certain corporate matters. Shareholders typically have the right to vote in elections for the board of directors and on proposed operational alterations such as shifts of corporate aims and goals or fundamental structural changes.
Shareholders also have the right to vote on matters that directly affect their stock ownership, such as the company doing a stock split or a proposed merger or acquisition. They may also have the right to vote on executive compensation packages and other administrative issues.17
Since Blackrock issues ETFs, and since ETFs are just a basket of stocks, Blackrock has to own the underlying stocks of the ETFs they issue, and since a stock is company ownership and voting rights, Blackrock and others have put themselves in very influential positions;
The firm is one of the top three shareholders of more than 80% of the companies in the S&P 500, according to S&P Global Market Intelligence, through its many funds. The money manager casts a long shadow on shareholder meetings where it can vote on behalf of its investors on board directors, executives’ pay packages and other company matters.18
Now that we have a better picture of different kinds of IIs, we can go further into how they operate differently in markets.
Behaviors of IIs: Different entities sell for different reasons
Just because Jeff Bezos sold "some" stock does not necessarily mean he thinks Amazon is overvalued or is going to implode imminently (though part of this is size-dependent), as is typically assumed when insiders sell. In that particular case, it is well known that Bezos also runs Blue Origin and uses Amazon proceeds to fund it.
Contrast this to a Bitcoin mining company selling $BTC to “keep the lights on”;
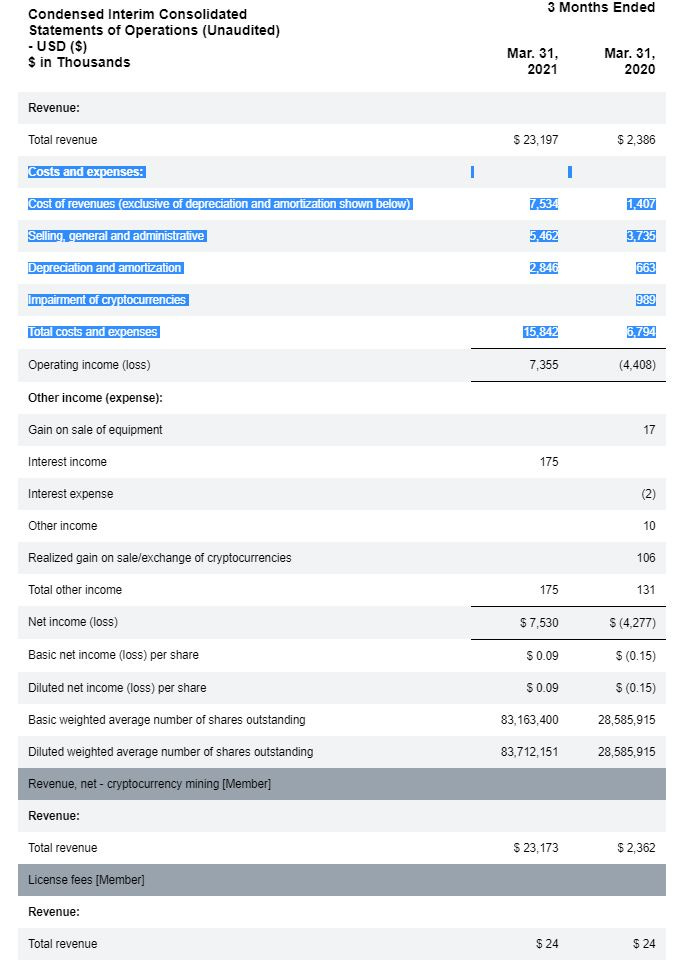
Or more recently to fund a migration.
Tesla apparently sold 10% of it’s $BTC to “prove liquidity”.
Portfolio rebalancing is primarily a strategy to mitigate risk by buying and selling portions of the portfolio in order to set the weight of each asset class back to its original position. There are various kinds of rebalancing strategies that are time, size, and proportional based, many of which are predetermined.
Then there’s the poor retail (not II) who sold because the reason they invested was “because it’s going to go up” and then it stopped going up.
Liquidity

A key element of markets that IIs in particular care about is liquidity. In order to further understand the significance of liquidity, one should understand orderbooks and their effect on price mechanics.
Key things to note about orderbooks:
Every buy order executes by matching opposite/equivalent sell orders (one buy order can be filled by various smaller sell orders) , and vice versa.
Once an order gets executed, it has a chain reaction of incentives acting on the price of the next orders. In other words; if no one is there to match your order, then you are forced to move your price point if you want to execute a market order.
The “depth” of the market and the bid-ask spread determine how sensitive the price will be to orders.
How IIs take the plunge
actual footage of an institutional investor eating up sell-side liquidity
The following is an example of how large IIs deal with liquidity in stocks like Coca-Cola;
Yeah, it isn't as easy as it looks to buy these big positions. When we were buying Coca-Cola, we were buying every share we could with our what, 30 or 40 percent of the daily trading? And it took us a long long time to get our position and there are huge difficulties to managing great big common stock portfolios. We like it way better when we have those problems now than when we liked it when we didn't have them earlier but it does make it much harder, we have no easy way of moving these elephants around.
In general, we think we usually could buy something like 20% of the daily trading volume and feel that we're not causing the price to be violently different than it would have been if we hadn't been participating in the market so that means if we're gonna buy five billion dollars worth of something, twenty five billion dollars worth of it's going to have to trade and that's a lot for many stocks. We are a big ocean liner and that has its disadvantages compared to being a smaller boat. 19
OTC is worth mentioning here. Primer on Over-The-Counter trading;

Coinbase facilitating institutional-size trades;
In an announcement shared with The Block, the San Francisco-based cryptocurrency exchange said its Coinbase Prime unit which spans prime brokerage and over-the-counter (OTC) trading services — served as the primary execution services partner for Virginia-based MicroStrategy's $425 million bitcoin purchase made earlier this year. 20
Our system takes a single large order and breaks it into many small pieces that are executed across multiple trading venues. This type of smart order routing minimizes the trade’s market impact and helps disguise the overall trade size. Leveraging our technology, the trading team achieved an average execution price that was less than the price at which buying started. In periods of high volatility, our advanced trading tools improved the client execution by as much as 1%. For MicroStrategy, this strategy resulted in savings of approximately $4.25 million.21
"Using our advanced execution capabilities, leading crypto prime brokerage platform, and OTC desk, we were able to buy a significant amount of bitcoin on behalf of MicroStrategy and did so without moving the market," Brett Tejpaul, head of institutional sales, custody and prime services at Coinbase, said in a blog post.
"Coinbase’s Time Weighted Average Price (TWAP) algorithm will complete an order over a specified window of time, splitting the main order into many smaller orders that are then sent to different pools of liquidity, using the Smart Order Router to choose the best pool. In the example of the MicroStrategy execution, while the human traders input a few hundred orders, the algorithms converted that into close to 200,000 child fills, where the average fill size was less than 0.3 BTC."22
Overview of $ETH’s liquidity through the years
Spot Volume
“Spot market total volume for BTC and ETH on cryptocurrency exchanges. Includes largest exchanges with trustworthy reporting of exchange volume metrics. Chart uses 7-day moving average.”23
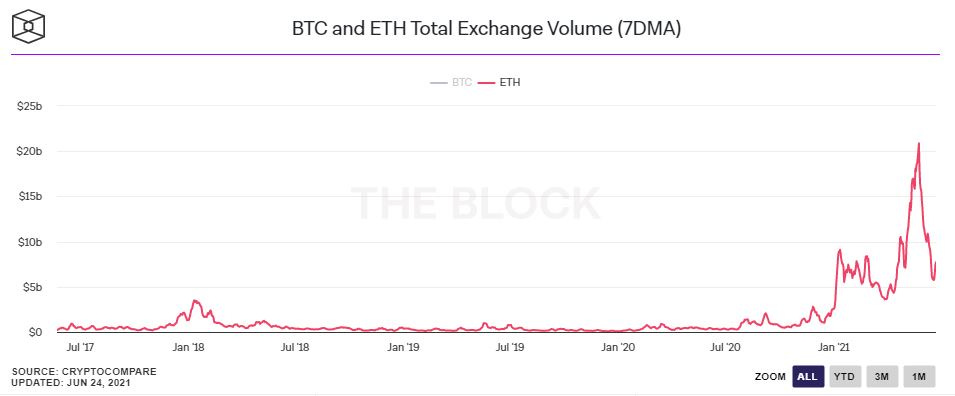
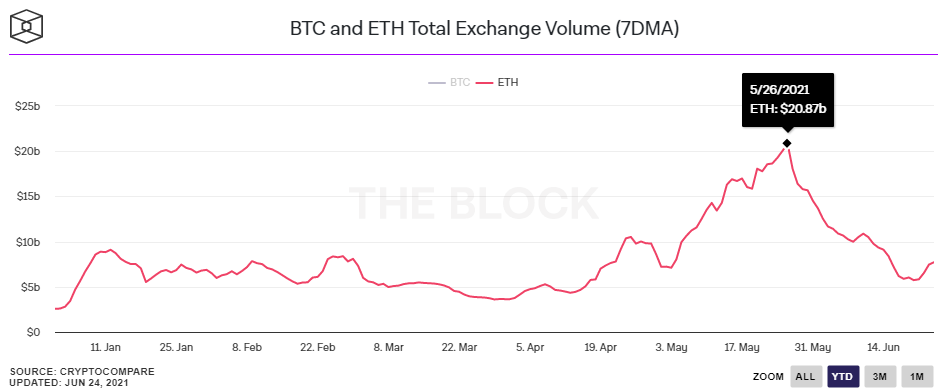
$ETH’s 2018 trading volume peaked in on January 14th at $3.44 B (7 day moving average).
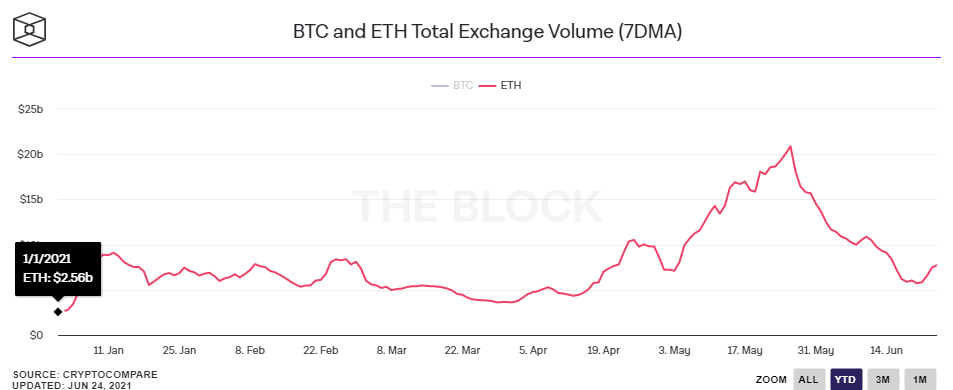
This year started with $2.56 B (7D MA) in volume and never returned to that level, topping out at $20.87 B.
During AAPL’s peak on January 25 this year, volume was 157,612,000 shares at a close of $142.19; giving us $22.41 B in daily volume.
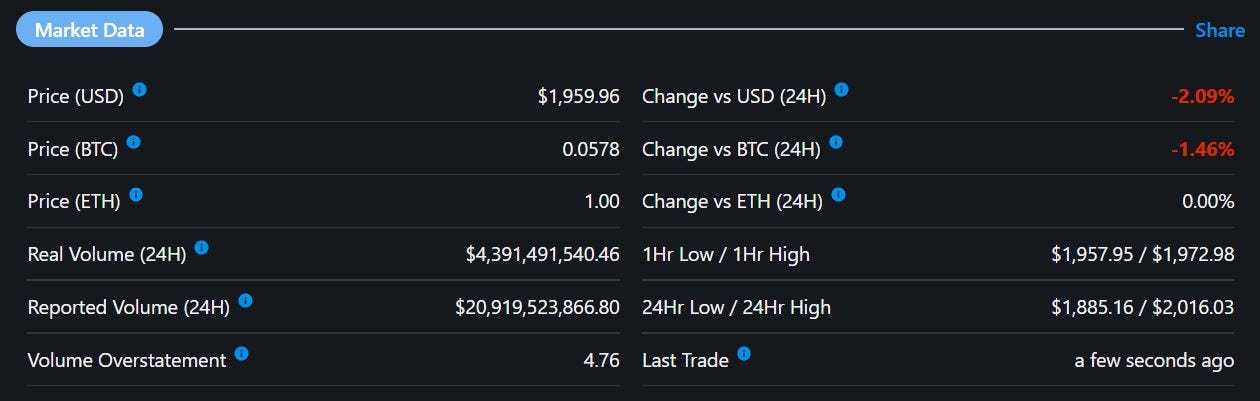
Messari uses “real volume”;
This is the trading over the last 24hrs from the 10 exchanges identified by Bitwise Investments as well-functioning markets.
As of early 2019, it is suspected that the majority of reported global trade volume is due to wash-trading or other practices that are not representative of well-functioning markets. This 'Real 10 Volume' metric omits volume from exchanges that don't show consistent patterns of well functioning markets. The 10 exchanges meeting that criteria, as identified by Bitwise Investments are: Binance, Kraken, Bitfinex, Coinbase, Bitstamp, BitFlyer, Gemini, itBit, Bittrex, and Poloniex.
At the time of writing (a weekday not a weekend), the “real” daily volume for $ETH was $5.24 B.
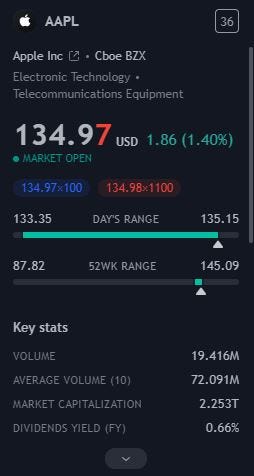
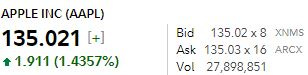
At the time of writing, AAPL’s trading volume was 19,416,000 shares x $134.97/share; $2.620 B. Roughly half of $ETH’s “real” volume.
However, this is just an arbitrary snapshot in time and liquidity is not just simply a measure of volume, but also the concentration/distribution of volume. As previously mentioned, the bid/ask spread is a key aspect of market liquidity.
Below is a snapshot comparison between $APPL on Fidelity and $ETH on Coinbase Pro;
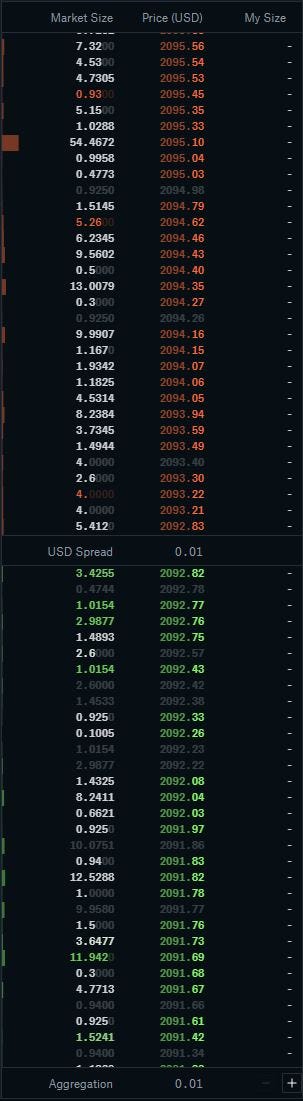
However, during significant market moves, these spreads will fluctuate and there is some seasonality in markets.
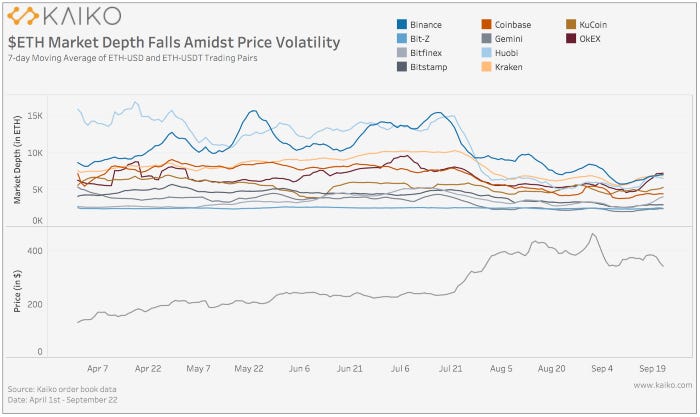
We can observe that as the price of ETH began to rise at the end of July, market depth fell sharply, which is expected behavior in times of price volatility as market makers adjust their positions for increased risk. However, the sharp decline in market depth cannot be fully explained by volatile prices, and is perhaps related to the growth of ETH liquidity pools on decentralized exchanges which could be drawing funds from centralized exchanges. At the same time, we also saw a sharp rise in ETH transaction fees.
It is difficult to fully understand why ETH market depth has fallen so dramatically since July as there are likely a combination of factors at work including higher volatility, the growth of decentralized liquidity pools, higher transaction fees, and an overall increase in market risk caused by continuing economic uncertainty.24
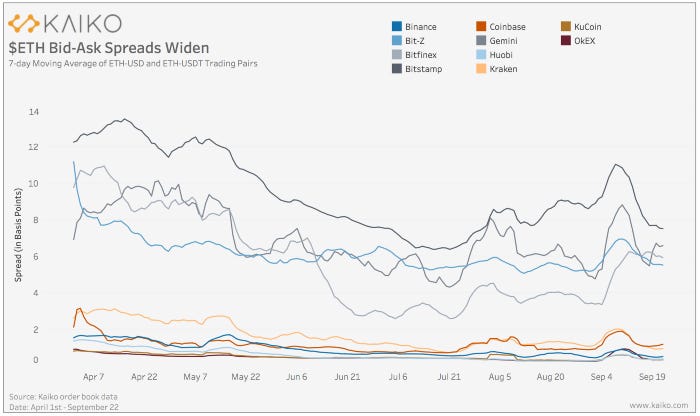
For much of the summer, ETH spreads narrowed as price volatility declined across all cryptocurrency markets. However, spreads began to widen at the end of July as ETH underwent a mini-bull run. Market makers widen spreads to account for more risk in times of volatility. We can observe that spreads have remained volatile since July, corresponding with on-going price movements triggered by events in the DeFi space.25
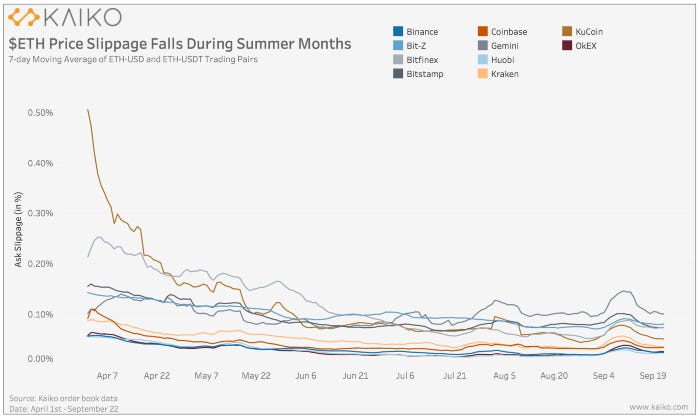
Slippage remains low. Price slippage is closely tied with market depth and measures the difference between the expected price of a trade and the price level arrived at after execution.High price slippage typically indicates a market is less liquid. Following the March market crash, price slippage was higher than average well into May for most ETH trading pairs. However, since mid-June, slippage has remained relatively low, rising only slightly during the price volatility experienced towards the end of the summer.26
Ethereum’s Liquidity Evolution
What about DeFi?
DeFi, or decentralized finance is a sector within crypto relating to TradFi (traditional finance) parallels such as lend/borrow protocols, exchanges, synthetics, etc, with the benefits of a public blockchain and without the traditional corporate structure .
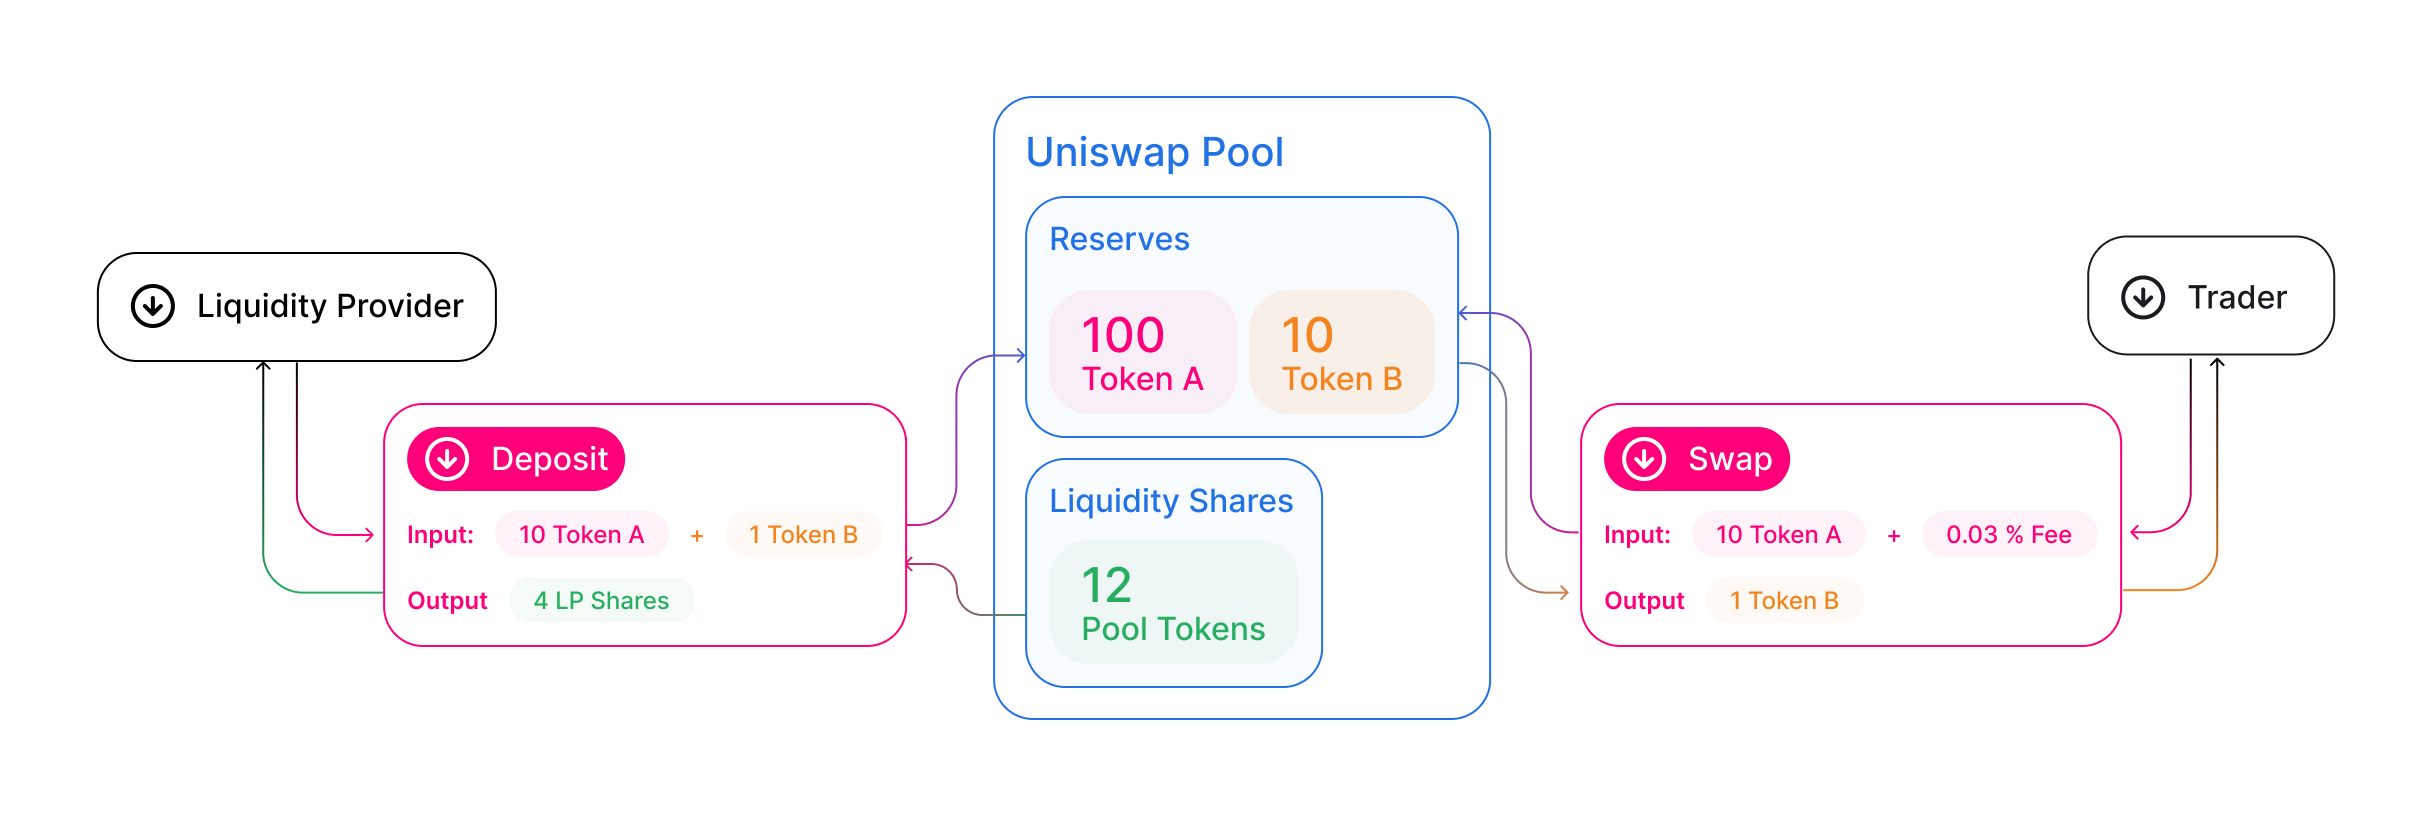
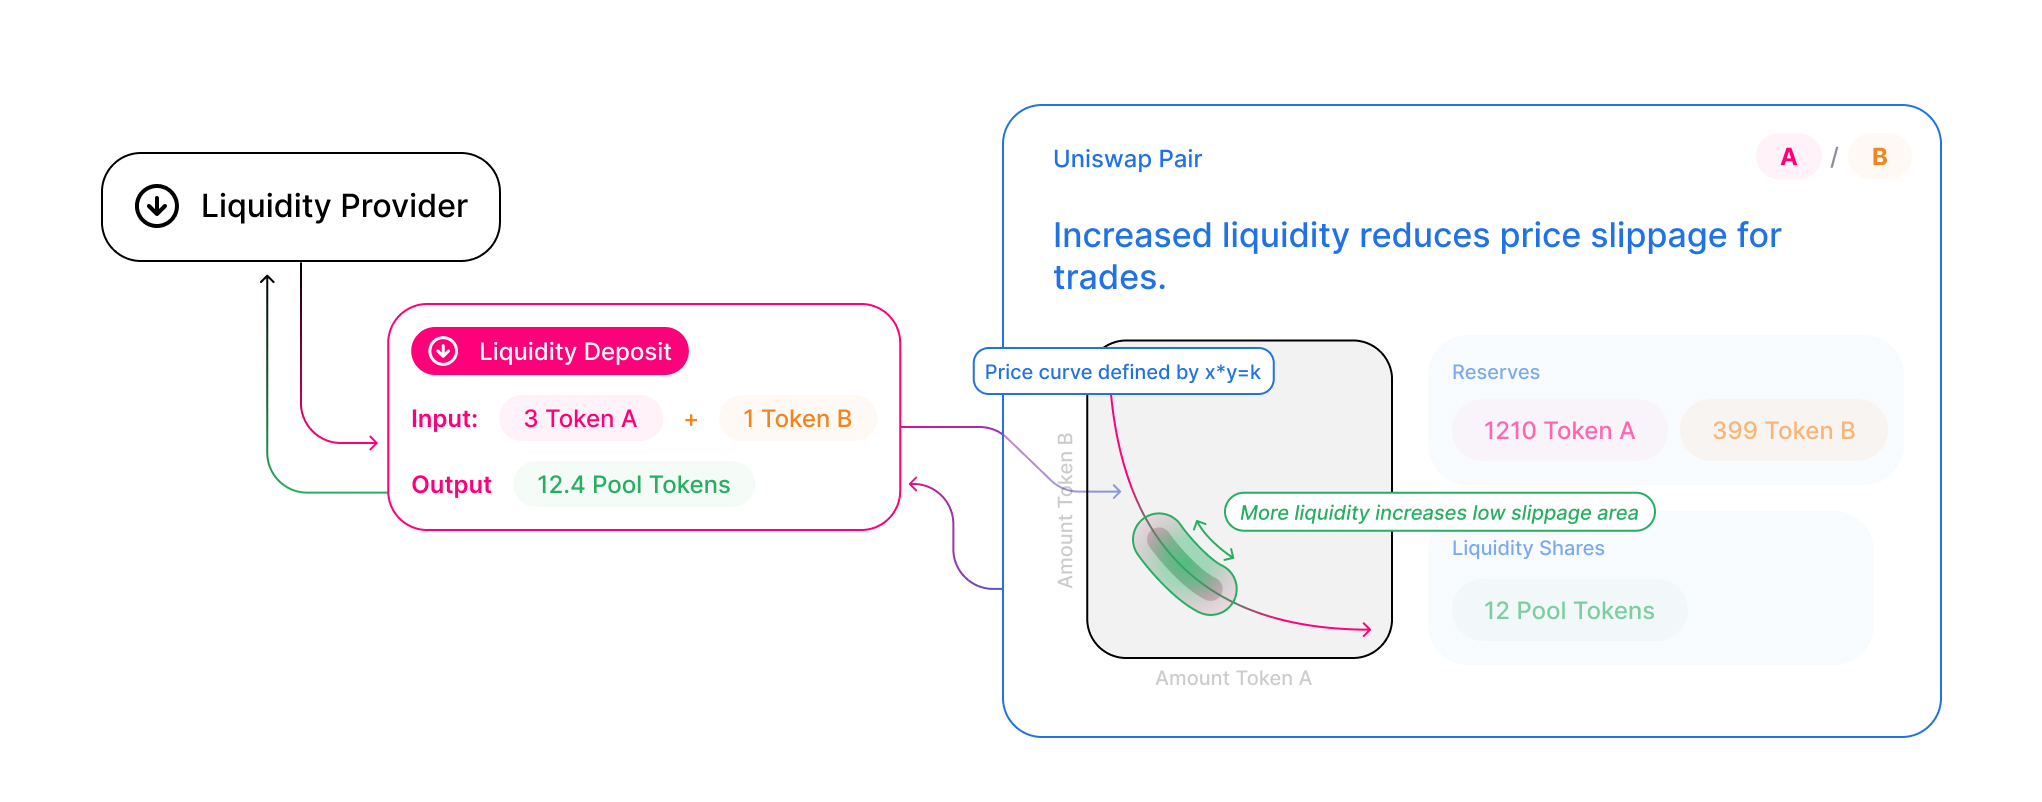
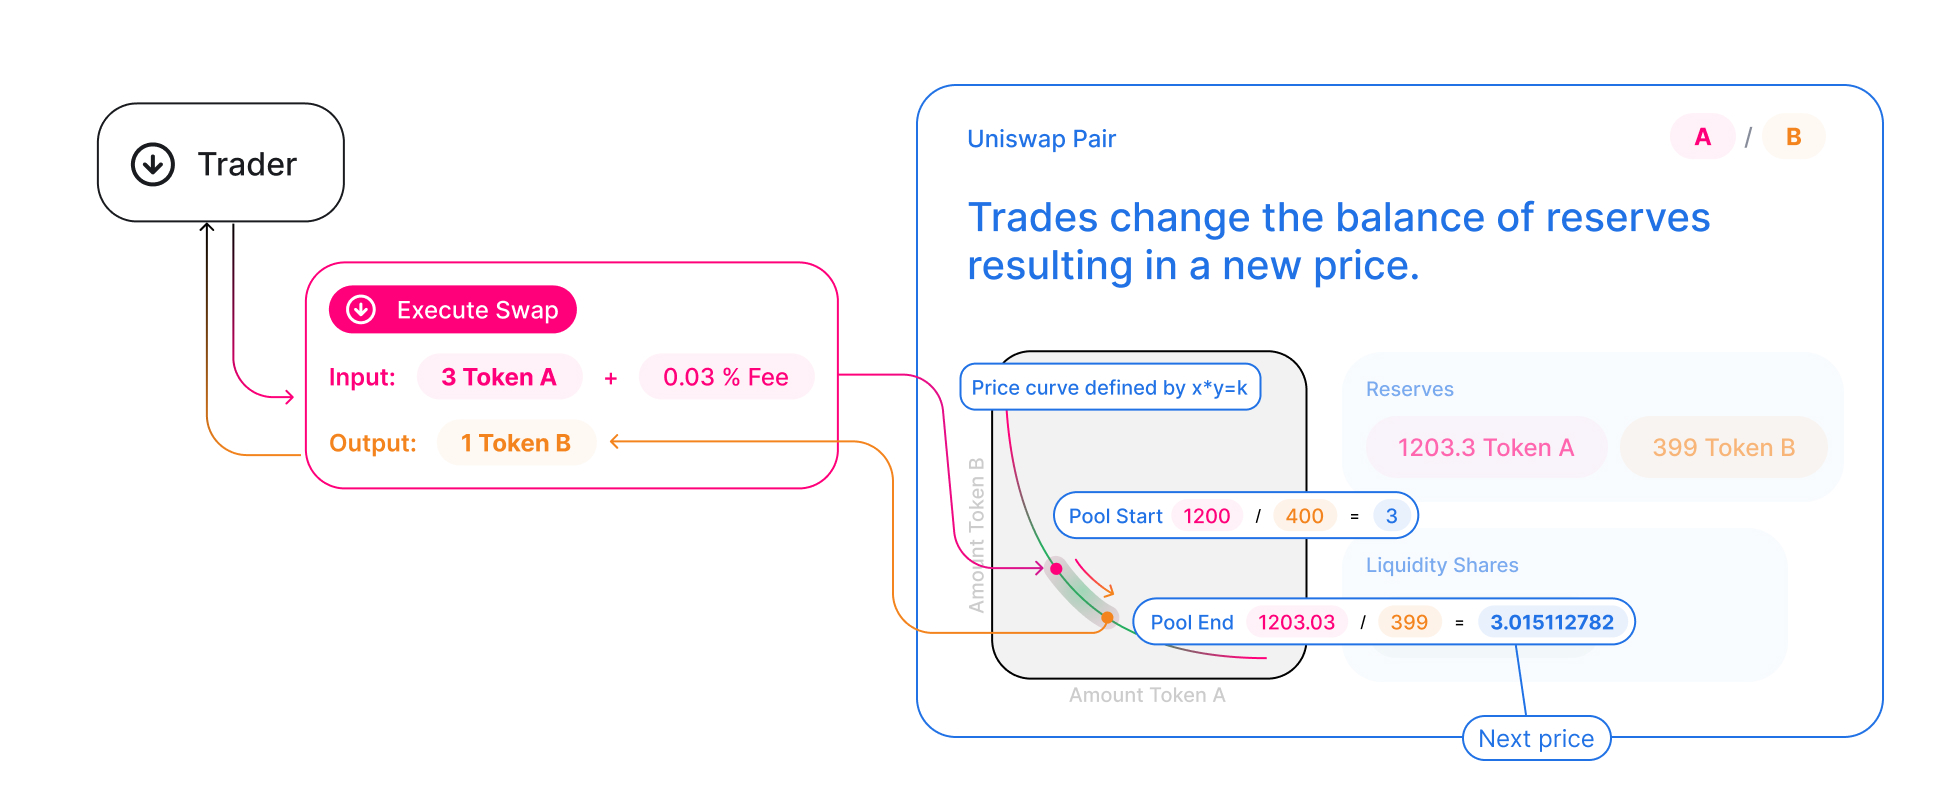
Since blockchains are inherently slow (for now), slippage is a significant concern for users/traders. Some mechanics of how this is dealt with on Uniswap;
Uniswap is an automated liquidity protocol powered by a constant product formula and implemented in a system of non-upgradeable smart contracts on the Ethereum blockchain. It obviates the need for trusted intermediaries, prioritizing decentralization, censorship resistance, and security.27
How Uniswap Exchange works;
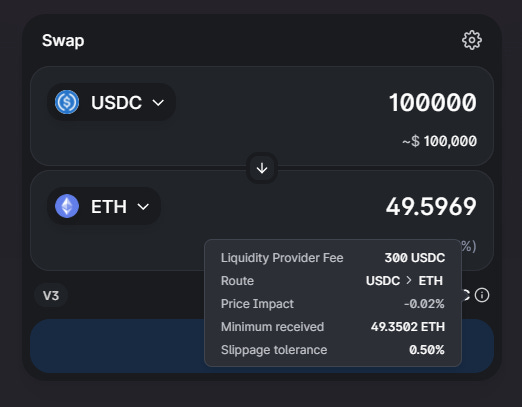
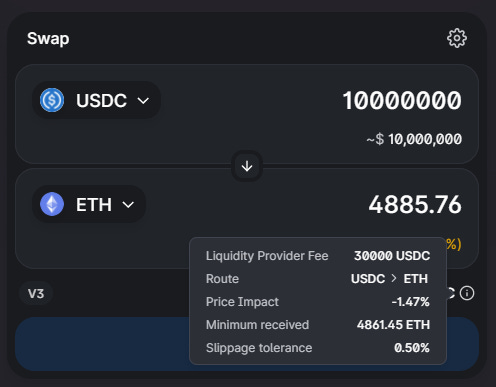
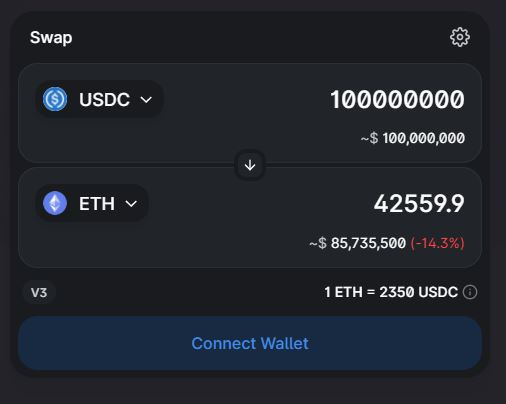
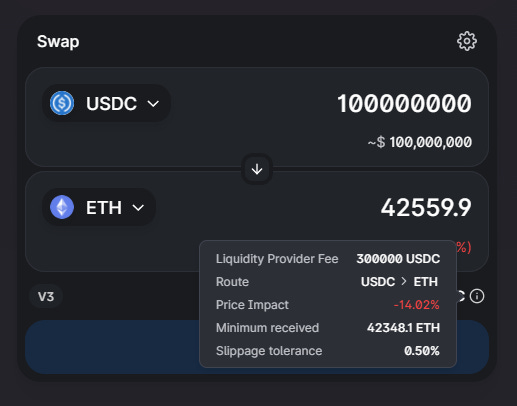
The following is a preview of what various larger buys would get you on Uniswap V3';
$100k buy
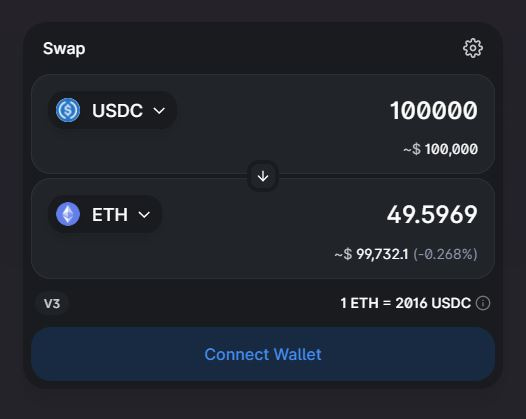
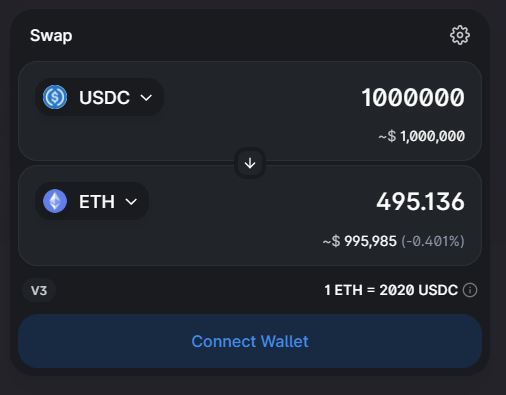
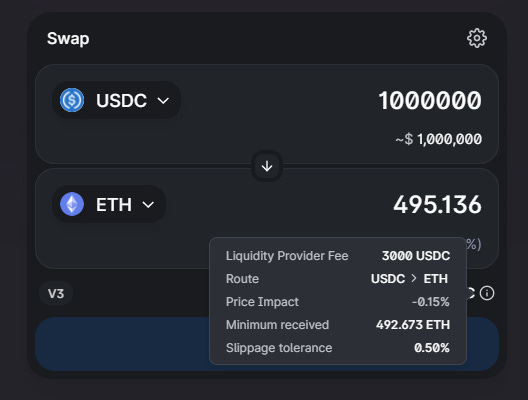
$1m buy
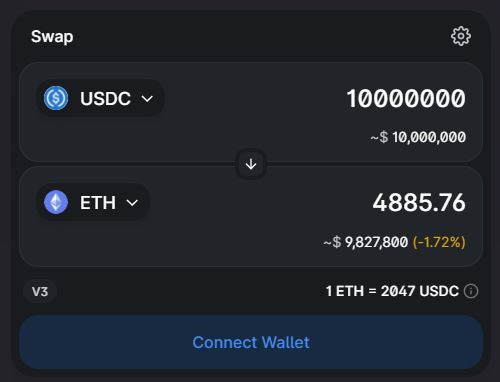
$10m buy
$100m buy
$1b buy
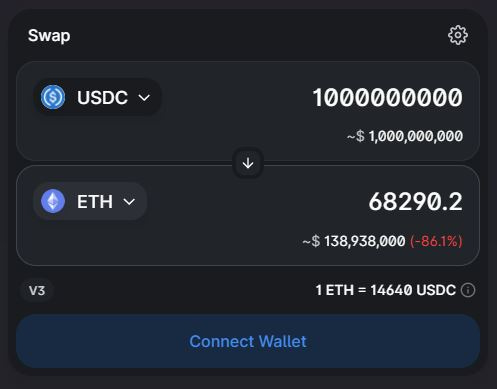
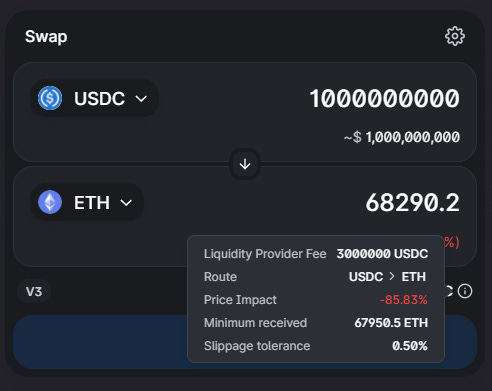
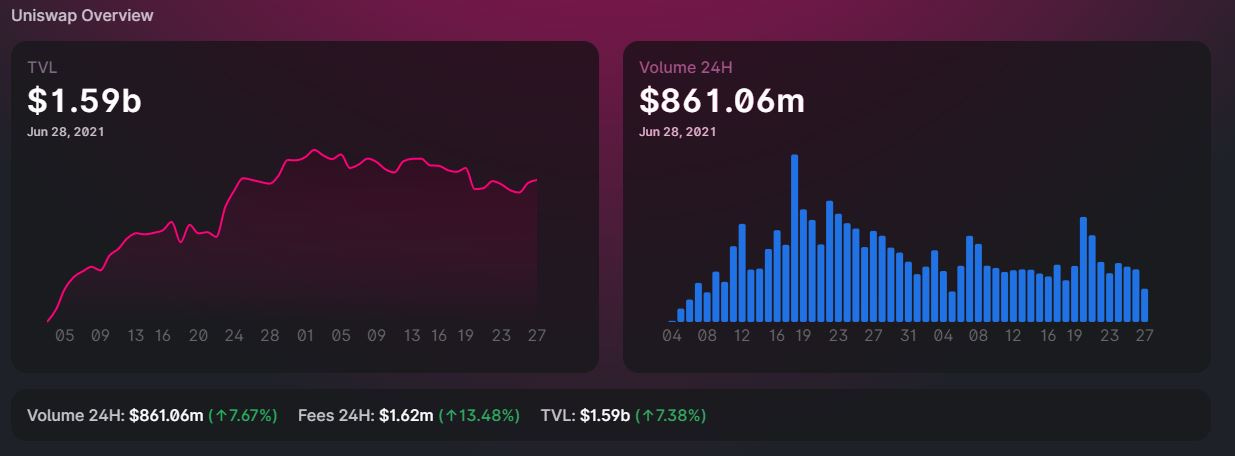
The drop in capital efficiency is not surprising here considering Uniswap V3 (launched May 5 this year) only has $1.6 B in liquidity locked in smart contracts (all versions combined are approximately $5.3 B).
This may seem like an unnecessary route or way to dodge regulations but one of the key differences between DeFi and TradFi is that DeFi has more finality because it settles publicly, in real-time (see It’s Time for Real-Time Settlement). It is safe to say that larger IIs cannot take the plunge via DeFi yet, at least not in MicroStrategy size.
Derivatives Volume
Although Robinhood has popularized financial derivatives by lowering the barriers of entry and “gamifying” options trading, derivative products are intended for “sophisticated” and large players for various reasons such as to speculate on an asset’s performance without holding the underlying asset, and hedging/mitigating risk.
Futures And Perpetuals Open Interest28
3/1/20 Futures OI was $503.61 M, $4.67 B on 3/1/21; a 828% increase.
Futures OI peaked at $11.60 B.
March 2020 futures volume was $92.8 B, $518.7 B in March 2021; a 459% increase.
Futures volume peaked at $1.76 T.
Since crypto-native exchanges have a cloud of regulatory uncertainty hanging over them, their derivatives products are not considered as “clean” as those traded on the CME. Recently, CME Group announced the launch of Ether Futures.
CME futures (debuted Feb 8) volume was $1.3 B in February, peaked in May at $24.68 B; an 1,798% increase.
CME futures OI started at $64.53 M in February, peaked in May at $476.45 M, a 638% increase.
Large OI CME Ether futures holders started at 22 in April and peaked at 44 in May, a 100% increase.
6/23/20 Options OI was $173.87 M, $3.12 B on 6/23/21; a 1,694% increase.
Options OI peaked at $7.4 B.
July 2020 options volume was $535.7 M, peaking in May 2021 at $16.51 B, a 208% increase.
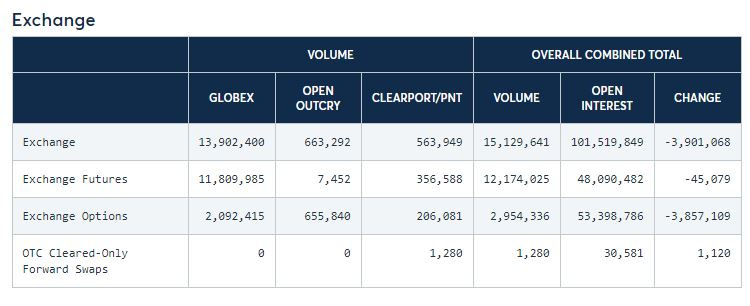


$ETH futures volume (from crypto-native exchanges) topped out at $1.76 T in May. Contrast this to the total CME exchange futures volume of $12.17 T ($12,174,025 x 1,000,000 - 3,735,000,000) for June 25.
Considering the market has changed since May and there is limited public CME data available, we can compare $ETH’s June futures volume (from crypto-native exchanges) of $809 B (as of June 28) and extrapolate the June 25 CME data for 28 days to get $340.76 T; roughly 0.20 % of the total monthly futures volume on CME exchanges.
$ETH options volume (from crypto-native exchanges) topped out at $16.51 B in May. Contrast this to the total CME options volume of $2.95 T ($2,954,336 x 1,000,000) for June 25.
Again, considering the market has changed since May and there is limited public CME data available, we can compare $ETH’s June options volume (from crypto-native exchanges) of $16.51 B (as of June 28) and extrapolate the June 25 CME data for 28 days to get $82.72 T; a negligible % of the total options volume on CME exchanges.
Comparing to Metals
You might have “precious crypto,” Tudor Jones pontificated. That might be Bitcoin, he said, since it has “historical integrity;” it was the original cryptocurrency and the first mover. “Because of its finite supply, that might be the precious crypto.” Then you’ll have more transactional crypto, he said, just like industrious metals such as copper and lead.29

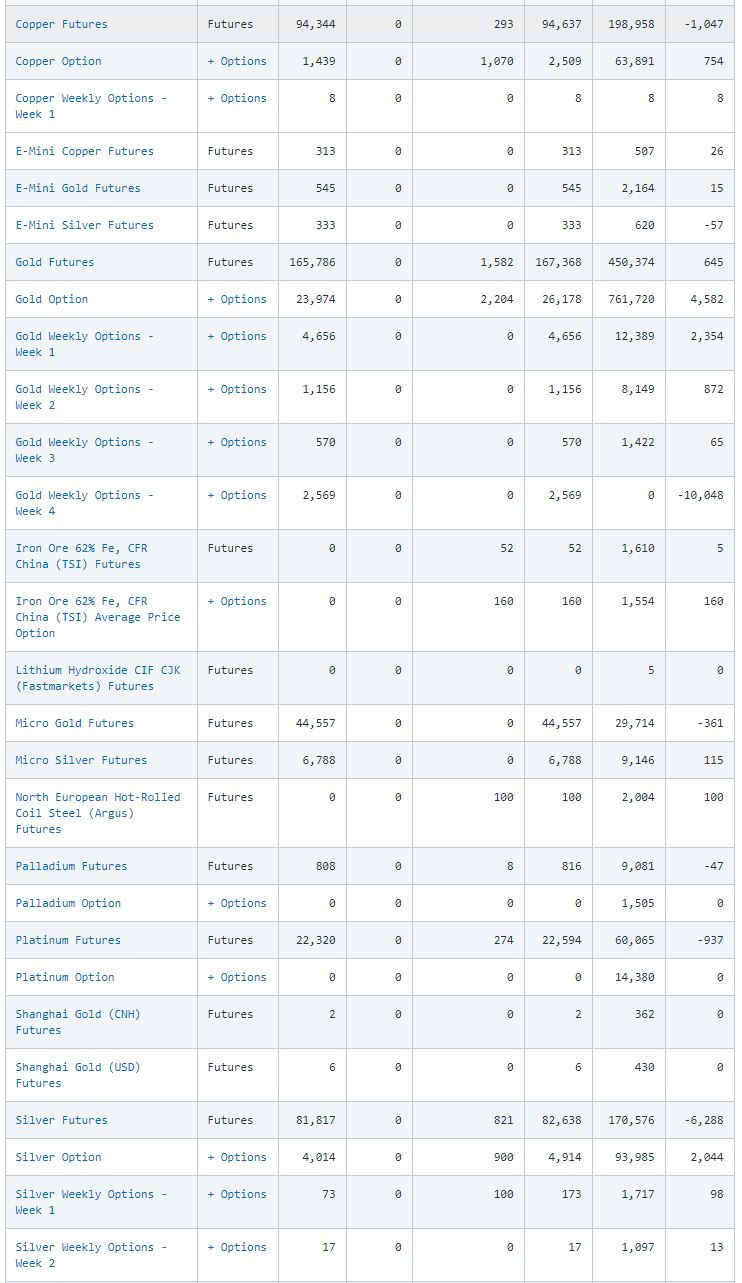
$ETH CME Futures volume of $3.735 B vs Copper CME Futures of $94.34 B for June 25th.
$ETH CME Futures volume of $3.735 B vs Silver CME Futures of $81.82 B for June 25th.
$ETH CME Futures volume of $3.735 B vs Platinum CME Futures of $22.32 B for June 25th.
$ETH CME Futures volume of $3.735 B vs Palladium CME Futures of $0.808 B for June 25th; 462% more volume.
Investment Products
Investments products (vehicles) enable "click of a button” ease of trading financial assets. The problem is that in crypto, there aren’t many good options.
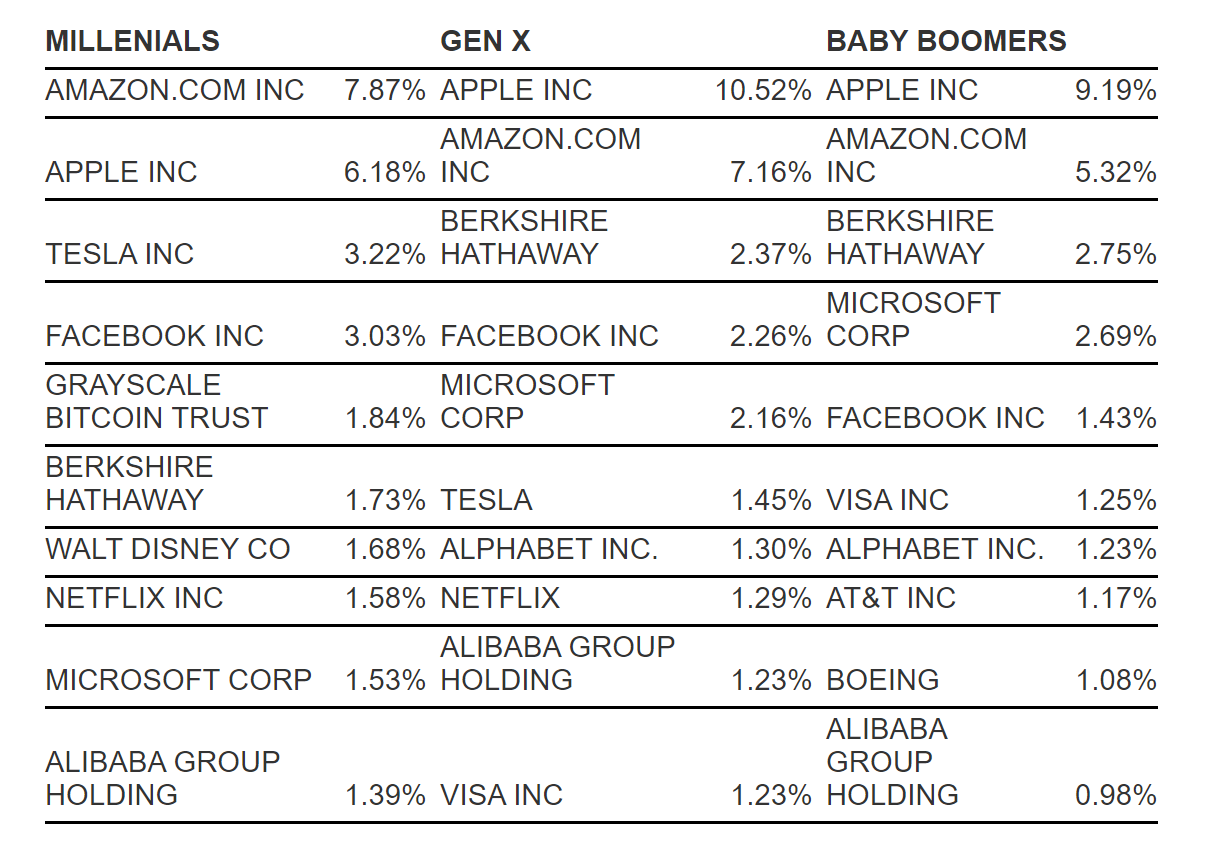
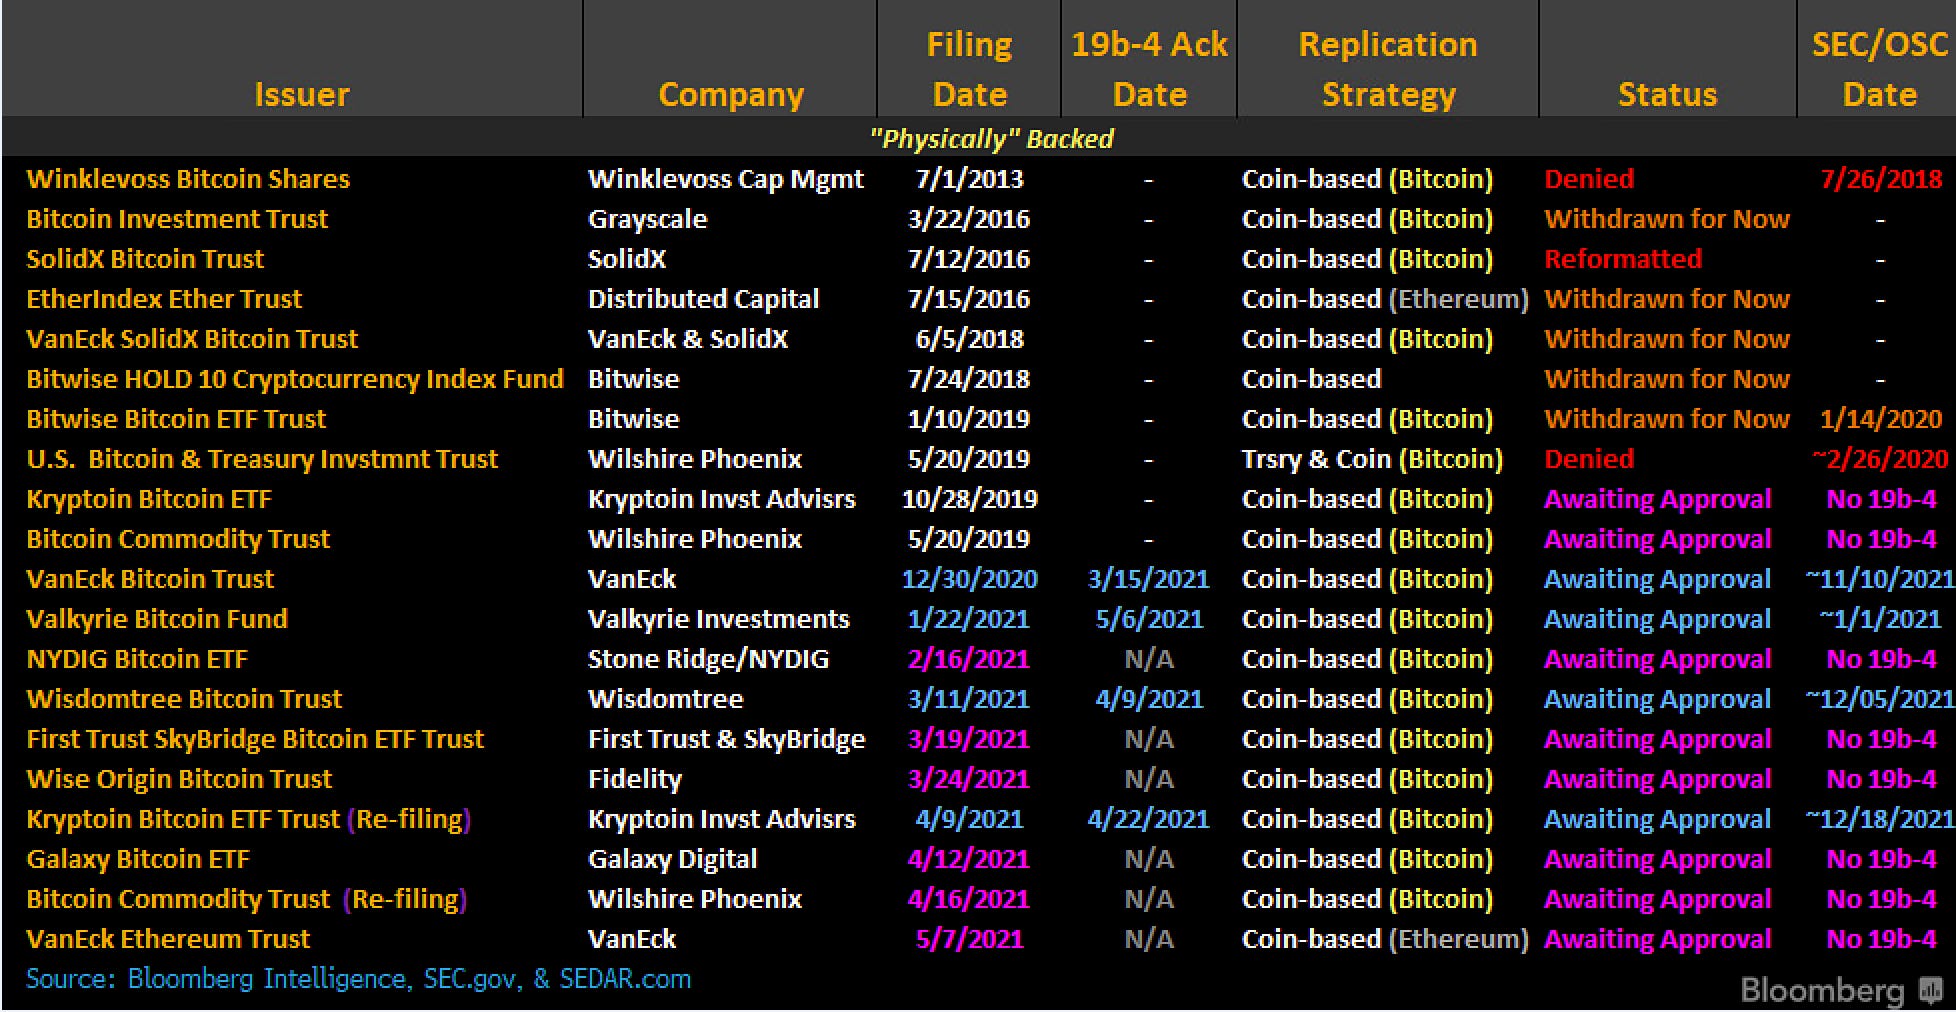
It’s no secret that crypto ETFs have had a hard time getting past the SEC for about 8 years now. However, Grayscale has done well filling this gap for some IIs as it is a legitimate registered security and therefore eligible to be held in IRAs and other brokerage accounts. At the time of writing, Grayscale has $22.4 B AUM. Their main product; Grayscale Bitcoin Trust ($GBTC) was even a top 5 equity holding among millennials30.
Sounds great, but the Grayscale products have historically traded at mind-boggling premiums, for various reasons. That makes it unattractive for serious players. As more crypto ETFs get filed, the less power the Grayscales of the world have over the average investor (though Grayscale expects to transform itself).
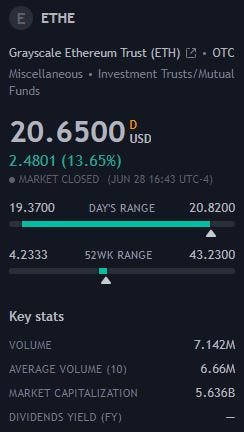
Trading volume at the time of writing for $ETHE is $147.48m, according to Trading View.


Some data on other products;
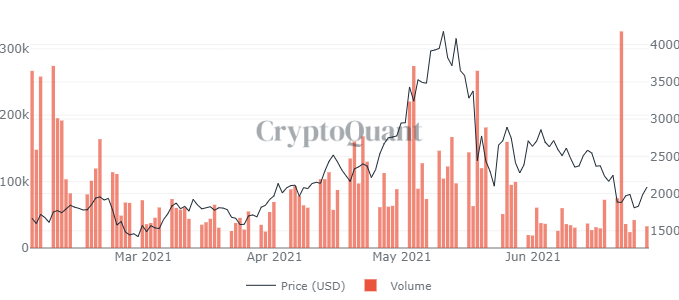
$ETHE trading volume peaked at $313.89 M on 5/11/21.
There are other public products like Bitwise, and various ETPs and ETNs. However, there are also more private structured products now starting to be offered by the likes of Goldman;


On-Chain Volume
Txs on Ethereum started at 44.57 K on 1/8/2017, peaked at 1.66 M on 5/15/21; a 3,624% increase.
On-chain daily volume started at $26.96 M on 1/8/17 and peaked at $32.42 B on 5/13/21.
March 2017 on-chain volume started at $4.93 B and peaked in May 2021 at $666 B; a 134x increase.

On-chain metrics are more pure because we can just rely on the blockchain data as opposed to what centralized exchanges report. At the time of writing, Ethereum has facilitated nearly $2 T in on-chain volume in H131. That is settlement, not payment.
The modern ACH Network saw volume soar in the first quarter of 2021, setting two new records in the process.
Quarterly volume of 7.1 billion payments was an increase of 11.2% from the same period in 2020. The value of those payments was $17.3 trillion, reflecting a nearly 19% increase from a year earlier.
The first new record was set in February, when ACH volume averaged more than 118 million payments per day, the ACH Network’s highest daily average for a month.
The second was in March, when ACH volume hit 2.7 billion payments, the largest monthly volume in ACH Network history. This included approximately 110 million economic impact payments by Direct Deposit from the federal government.32
Comparing Q1s; $712 B on Ethereum vs $17.3 T by ACH, approximately 4% of ACH volume.
Not bad for a <6 year old asset.
Ethereum has matured dramatically in the past year and one can argue that $ETH is partially already an investment-grade asset, with more infrastructure coming;
Cryptocurrency Comes to Retirement Plans as Coinbase Teams Up With 401(k) Provider
Interactive Brokers will offer crypto trading by the end of the summer


Ethereum has 'much higher utility' than Bitcoin, says Guggenheim co-founder Todd Morley


Some highlights;
$ETH’s trading volume surpassed $AAPL’s in isolated time frames this year
$ETH CME futures trading volume surpassed Palladium CME futures trading volume
Uniswap V3 not ready for large II buys
$1.76 T in $ETH (crypto-native exchanges) Futures Volume in May
This year started with $2.56 B (7D MA) in trading volume and never returned to that level, topping out at $20.87 B.
3/1/20 Crypto-native futures OI was $503.61 M, $4.67 B on 3/1/21; a 828% increase.
Crypto-native Ether futures OI peaked at $11.60 B.
Crypto-native March 2020 ether futures volume was $92.8 B, $518.7 B in March 2021; a 459% increase.
Crypto-native Ether futures volume peaked at $1.76 T.
CME futures (debuted Feb 8) volume was $1.3 B in February, peaked in May at $24.68 B; an 1,798% increase.
CME futures OI started at $64.53 M in February, peaked in May at $476.45 M, a 638% increase.
Large OI CME Ether futures holders started at 22 in April and peaked at 44 in May, a 100% increase.
6/23/20 Crypto-native Ether options OI was $173.87 M, $3.12 B on 6/23/21; a 1,694% increase.
Crypto-native Ether options OI peaked at $7.4 B.
July 2020 crypto-native Ether options volume was $535.7 M, peaking in May 2021 at $16.51 B, a 208% increase.
$2 T in on-chain volume in H1.
Comparing Q1s; $712 B on Ethereum vs $17.3 T by ACH, approximately 4% of ACH volume.
$ETH CME Futures volume of $3.735 B vs Copper CME Futures of $94.34 B for June 25th.
$ETH CME Futures volume of $3.735 B vs Silver CME Futures of $81.82 B for June 25th.
$ETH CME Futures volume of $3.735 B vs Platinum CME Futures of $22.32 B for June 25th.
$ETH CME Futures volume of $3.735 B vs Palladium CME Futures of $0.808 B for June 25th; 462% more volume.
Txs on Ethereum started at 44.57 K on 1/8/2017, peaked at 1.66 M on 5/15/21; a 3,624% increase.
March 2017 on-chain volume started at $4.93 B and peaked in May 2021 at $666 B; a 134x increase.
$ETHE trading volume peaked at $313.89 M on 5/11/21.
https://www.investopedia.com/terms/i/institutionalinvestor.asp#:~:text=Key%20Takeaways-,An%20institutional%20investor%20is%20a%20company%20or%20organization%20that%20invests,subject%20to%20less%20regulatory%20oversight.
https://www.investopedia.com/articles/financial-theory/11/introduction-institutional-investing.asp
https://www.statista.com/statistics/271771/assets-of-the-hedge-funds-worldwide/#:~:text=In%202020%2C%20the%20value%20reached,managers%20in%20the%20United%20States.
https://www.investopedia.com/articles/credit-loans-mortgages/090116/what-do-pension-funds-typically-invest.asp
https://www.swfinstitute.org/fund-rankings/endowment
https://www.google.com/search?q=blackrock+aum&safe=active&ei=_CzTYPevC8eb_Qad3ojoAw&oq=blackrock+aum&gs_lcp=Cgdnd3Mtd2l6EAMyBQgAELEDMgUIABCRAjICCAAyAggAMgIIADICCAAyAggAMgIIADICCAAyAggAOgcIABBHELADOgcIABCwAxBDOg0ILhCwAxDIAxBDEJMCOhAILhDHARCjAhCwAxDIAxBDOgoILhCwAxDIAxBDOggIABCxAxCDAToKCC4QxwEQrwEQQzoKCAAQsQMQgwEQQzoECAAQQzoLCC4QsQMQxwEQowI6CAgAELEDEJECOggILhDHARCvAUoFCDgSATFKBAhBGABQyO0BWOjwAWCQ8gFoAXACeACAAYMBiAHAA5IBAzMuMpgBAKABAaoBB2d3cy13aXrIAQzAAQE&sclient=gws-wiz&ved=0ahUKEwj3nazJ5K3xAhXHTd8KHR0vAj0Q4dUDCA4&uact=5
https://about.vanguard.com/who-we-are/fast-facts/
https://www.fidelity.com/about-fidelity/our-company
https://www.google.com/search?safe=active&sa=X&q=State+Street+Corporation&stick=H4sIAAAAAAAAAONgFuLUz9U3MDY2N7dQ4gAxzfJyCrX4nfNzCxLzKoMzU1LLEyuLFzEqZJRb6Sfn5-SkJpdk5ufp5xelJ-ZlViWCOMVWiaW5i1glgksSS1IVgkuKUlNLFJzziwryi8DyE9gYAf4uADhpAAAA&ved=2ahUKEwjVgc376q3xAhVXGVkFHULEAYEQ-BYwNnoECAEQUQ
https://www.brokerage-review.com/investing-firm/assets-under-management/charles-schwab-aum.aspx
https://www.allianz.com/en/about-us/who-we-are/at-a-glance.html
https://www.swfinstitute.org/fund-rankings/sovereign-wealth-fund
https://www.swfinstitute.org/fund-rankings/insurance
https://www.bankrate.com/banking/biggest-banks-in-america/
https://startupanz.com/5-tech-giants-hold-588b-cash-reserves-apple-records-highest-decline-6-8-yoy/
https://www.preqin.com/insights/research/blogs/hedge-funds-does-size-matter#:~:text=According%20to%20Preqin's%20online%20platform,%25%20and%207%25%2C%20respectively.
https://www.investopedia.com/ask/answers/040315/what-can-shareholders-vote.asp#:~:text=Key%20Takeaways,of%20the%20shares%20someone%20owns.
https://www.wsj.com/articles/blackrock-takes-aggressive-posture-on-esg-proxy-votes-11619775002
youtube.com/watch?v=mcsWQaWclqM
https://www.theblockcrypto.com/post/86155/coinbase-says-it-was-behind-microstrategys-425-million-bitcoin-purchase
https://blog.coinbase.com/coinbase-is-helping-corporate-companies-diversify-with-crypto-444e8d91ebca
https://www.theblockcrypto.com/post/86155/coinbase-says-it-was-behind-microstrategys-425-million-bitcoin-purchase
https://www.theblockcrypto.com/data/crypto-markets/spot/btc-and-eth-total-exchange-volume-7dma
https://blog.kaiko.com/ethereums-liquidity-evolution-bb78d1547db6
https://blog.kaiko.com/ethereums-liquidity-evolution-bb78d1547db6
https://blog.kaiko.com/ethereums-liquidity-evolution-bb78d1547db6
https://docs.uniswap.org/V2/concepts/protocol-overview/01-how-uniswap-works
https://www.viewbase.com/futures
https://decrypt.co/50344/paul-tudor-jones-bitcoin-price-market
https://www.theblockcrypto.com/post/49451/bitcoin-more-popular-than-netflix-stock-among-millennials-gbtc-one-of-their-top-5-equity-holdings
https://www.theblockcrypto.com/data/on-chain-metrics/ethereum/ethereums-adjusted-on-chain-volume-monthly
https://www.nacha.org/content/ach-network-volume-statistics-1